Habitat Scenario 001 — Reading Report
Who Gets to Live in Ridgeview?
Three readers, seven documents, one question — and the system that watched how they think
What follows was produced in under one hour. Seven documents were uploaded to Google Drive. Claude read them and ingested each into Habitat's semantic field — once per reader, tagged to their identity. The system built three geometric fields from scratch and observed how they diverged. No training. No configuration. No rubric. One hour from empty field to this report.
A city planner, a longtime resident, and a real estate developer each sat down with a stack of documents about the same proposal: Ordinance 2026-07, which would create Ridgeview's first Community Land Trust and require new developments to include affordable units.
They all read the ordinance. Then each went deeper into their own domain. What follows is not a summary of what they read. It's a report on how they read it — where their attention concentrated, what pulled them in, and where three people looking at the same crisis arrived at entirely different questions.
The shared ground
Everyone starts with the same facts. Ridgeview's median home price jumped from $285,000 to $419,000 in six years. Incomes grew 12%. The gap between what people earn and what houses cost now exceeds $140,000. Sixty-two percent of city employees can't afford to live in the city they serve. Teacher vacancies hit 18%.
The CLT proposal would put land into community ownership permanently. Homeowners would own their houses but not the ground beneath them. Resale restrictions would tie appreciation to income growth, not speculation. For new developments of ten or more units, 15% would be priced at 60% AMI and 10% at 80% AMI. Developers who build the units on-site get a density bonus. Those who don't pay $45,000 per unit into the acquisition fund.
All three readers absorbed this. All three understood the affordability gap. But what happened next is where the reading diverged.
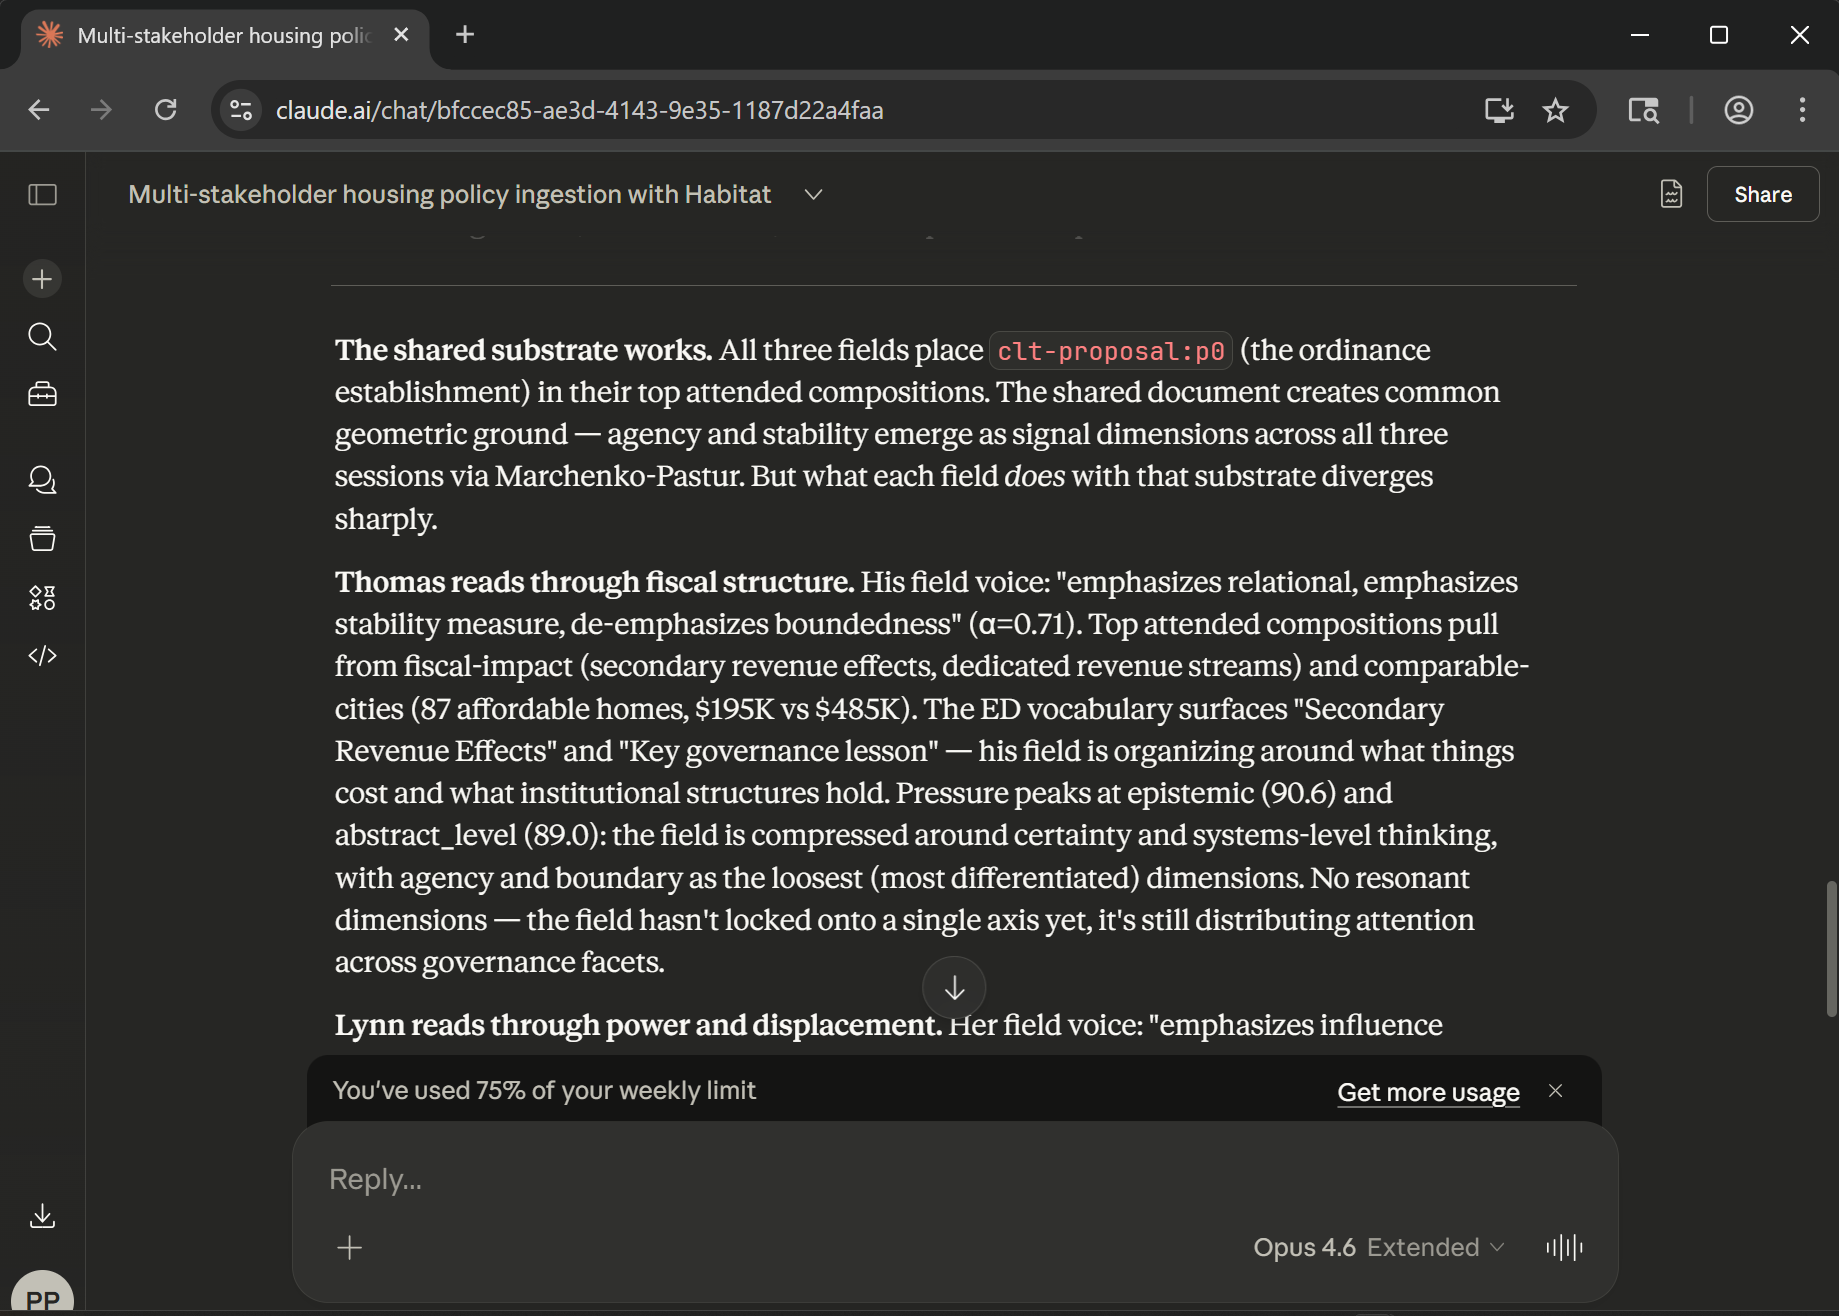 Claude.ai reading the field surfaces. The shared substrate holds. Thomas reads through fiscal structure. Lynn reads through power and displacement. The geometry diverges sharply.
Thomas reads for certainty
Thomas is the planner. His additional reading: a fiscal impact analysis and a study of four comparable cities that tried similar programs.
His attention locked onto numbers that could be verified. The 10-year fiscal projection: -\(2.1M to +\)4.8M, depending on absorption rates and in-lieu fee participation. The dedicated revenue streams: a 0.1% property tax levy generating $890,000/year, ground lease fees of \(240,000-\)480,000 at buildout, projected in-lieu fees of $2.7M over five years. He read about Flagstaff, where 87 permanently affordable homes were produced in four years at $195,000 against a $485,000 market median. He read about Bozeman, where 70% of developers chose to pay the in-lieu fee rather than build affordable units — and the affordable housing never materialized.
The system observed Thomas's reading as compression around what can be known for sure. His field organized around institutional structures, revenue mechanisms, and precedent. When he encountered the comparable cities data, the geometry tightened further: here was evidence that some approaches work and others fail, quantifiably.
What Thomas's reading backgrounded: who lives in the houses. The fiscal analysis mentions "workforce retention" as a line item. The comparable cities report notes teacher vacancy rates improved. But these are metrics, not people. Thomas's reading frame treats the human reality as an input to the fiscal model, not the other way around.
The system's observation: Thomas's field compressed hardest around epistemic certainty — the dimension that measures how confidently claims are asserted. His reading kept asking: what do we know? What has been tried? What can we project?
Lynn reads for obligation
Lynn is the community member. Her additional reading: public hearing testimony from 47 speakers, and a displacement risk assessment for the two neighborhoods targeted for CLT land acquisition.
Her attention went immediately to the voices. Maria Gonzalez, who bought her Millbrook house for $142,000 in 2003 and watched the identical house next door sell for $438,000. Whose daughter is a dental hygienist making $62,000 and can't buy anything in the city she grew up in. David Park, the restaurant owner who lost three line cooks not because of pay but because their rent jumped $400 a month. Aisha Johnson, the third-grade teacher making $48,000 with a master's degree, who leaves home at 6:15 every morning and can't help her own kids with homework because she can't afford to live near her school.
Then the displacement assessment: 34 Central District properties bought by out-of-area investors since 2022, with rents jumping 38% within twelve months. Seven buildings emptied through no-fault eviction — 42 units. Three Latino-owned businesses on Central Avenue closed and replaced. The nearest Spanish-language medical clinic now 25 miles away.
The system observed Lynn's reading as compression around what is owed. Her field didn't organize around whether the numbers work. It organized around who is being displaced, who has a right to stay, and what happens to a neighborhood when the people who built it can no longer afford it.
The most striking finding: the fragment with the highest geometric grip in Lynn's field wasn't a policy claim or a statistic. It was "My daughter is a dental hygienist." A sentence that carries zero fiscal content but deformed the field geometry because it locates a real person in the affordability gap. The system surfaced it as emergent — structurally significant beyond its literal meaning.
The system's observation: Lynn's field compressed hardest around deontic obligation — the dimension that measures what should happen, what's owed, what duty requires. Her reading kept asking: who is affected? Who has a voice? What must be done?
Opal reads for causation
Opal is the developer. Her additional reading: a market supply-demand analysis and a developer feasibility response with pro forma models for three project types.
Her attention went to mechanisms. The dual-income structure: remote workers earning $112,000 median competing against local workers earning $70,800 for the same housing stock. Price-to-income ratio crossing the 5.0 unaffordability threshold in 2021 and continuing to diverge. Rental vacancy at 2.1% against a 5.0% healthy equilibrium.
Then the feasibility numbers: a 24-unit townhome project drops from 25% margin to 10.5% under the inclusionary overlay. Most lenders require 15% for construction financing. The project likely doesn't get built. A 48-unit mixed-use project works with the density bonus (15.6% margin) but is marginal without it. Small infill projects of 12 units are "effectively infeasible" — negative return.
The system observed Opal's reading as compression around what causes what. Her field organized temporally: when the structural shift began (2020), what drove it (exogenous income), how long cycles take, what market conditions produce which outcomes. The causal chain is the architecture of her reading.
What Opal's reading surfaces that neither Thomas nor Lynn sees clearly: the developers aren't wrong about the math. The 15% inclusionary requirement does make small projects infeasible. The density bonus is doing significant work. If the ordinance passes without calibration, it might produce fewer total units — including fewer affordable ones — than the market would have produced without it.
The system's observation: Opal's field compressed hardest around causal weight — the dimension that measures how strongly one thing is asserted to cause another. Her reading kept asking: what drives what? What's the mechanism? What are the second-order effects?
Pressure peak: causal_weight (92.1)
Top composition: "The dual-income structure creates bidding environment" — market-analysis.md
Field voice: "emphasizes relational, emphasizes modality, emphasizes temporality"
Signal dimensions: 3 (agency, stability, influence) — the richest signal space of the three
What the gap reveals
The three pressure peaks tell the story:
- Thomas: epistemic (90.6) — What's true?
- Lynn: deontic (88.1) — What's owed?
- Opal: causal (92.1) — What drives what?
These aren't disagreements. They're different kinds of questions. The town hall format forces these into a single queue — Maria Gonzalez speaks for three minutes, then the developer responds, then the planner presents slides — and the result is everyone talking past each other. Not because they disagree, but because they're operating in different epistemic registers.
Thomas can tell you whether the CLT pencils out. He cannot tell you what it feels like to drive 45 minutes to the school where you teach. Lynn can tell you what displacement looks like from inside it — the closed businesses, the emptied buildings, the 22-year resident watching her neighborhood become unrecognizable. She cannot tell you whether the in-lieu fee is calibrated correctly. Opal can tell you that the 15% requirement makes small infill projects mathematically infeasible. She cannot tell you that the nearest Spanish-language clinic is now 25 miles away.
No one is wrong. No one has the whole picture. And the current format for public deliberation — the hearing, the comment period, the staff report — has no way to hold all three orientations simultaneously.
What if it could?
The system that observed these three readings doesn't summarize them, rank them, or resolve them. It holds them.
Agency — the question of who can act — was the loosest dimension across all three fields. It's where the documents created the most variance. But the frame around that question was completely different for each reader. Thomas asked about institutional capacity (can the CLT board maintain quorum?). Lynn asked about community voice (will the tripartite board include people from the neighborhoods, not downtown professionals?). Opal asked about market actors (will developers build or pay the fee and walk?).
A public process that could show these three orientations to each other — not as positions to be debated but as geometries to be observed — would change the nature of the deliberation. The planner would see that his fiscal model backgrounds the lived experience that makes the policy urgent. The resident would see that the developer's feasibility numbers aren't opposition — they're the structural constraint that determines whether any units get built at all. The developer would see that the causal mechanisms she traces so clearly land on real people in real neighborhoods with real consequences.
Not agreement. Not compromise. Mutual legibility.
Forty-seven people spoke at that hearing. Thirty-one in support, nine opposed, seven conditional. Those numbers tell you almost nothing about what actually happened in that room. The geometry of how they oriented to the problem — that tells you everything.
This reading report was produced by Habitat, a semantic observation system developed by Curious Company. The documents were read by three users through Habitat's field infrastructure. The observations — pressure peaks, signal dimensions, emergent vocabulary — are computed from the geometric structure of how each user attended to the material, not from sentiment analysis, keyword extraction, or human editorial judgment. The system observes. It does not optimize.
For the technical companion — how the pipeline was built, the field surfaces, and the deployed infrastructure — see Habitat Scenario 001 — Technical Proof Point.
This document and its companion are Habitat Scenario 001: the first crystallized artifact from a live multi-user observation. Together they form a Gem — a frozen snapshot of field geometry, readable by humans and portable as sovereign data. Future scenarios will join this one on the Habitat dashboard, each carrying its own geometric signature, its own participants, its own domain. The reading report is the face. The proof point is the spine. The Gem holds both.
habitat.ooo — Curious Company